| Table 12(Handbook of International Economic Statistics 1997-CIA) World
Crude Oil Prices |
| |
1973 |
1975 |
1980 |
1990 |
1992 |
1993 |
1994 |
1995 |
1996 |
| OPEC official average sales pricea |
| US $ per barrel |
3.39b |
11.02 |
30.87 |
21.76 |
18.33 |
16.08 |
15.44 |
16.84 |
19.83 |
| 1996 US $ per barrelc |
10.51 |
28.65 |
56.07 |
25.50 |
20.11 |
17.19 |
16.15 |
17.17 |
19.83 |
| World average price |
| US $ per barrel |
NA |
NA |
NA |
22.12 |
18.24 |
16.13 |
15.27 |
16.62 |
19.75 |
| 1996 US $ per barrelc |
NA |
NA |
NA |
25.92 |
20.01 |
17.25 |
15.97 |
16.94 |
19.75 |
a F.o.b. prices set by the OPEC governments for direct sales and, in most
cases, for the producing company buy-back oil. Weighted by the volume of production.
b Posted prices.
c Nominal price deflated by the US GDP price deflator.
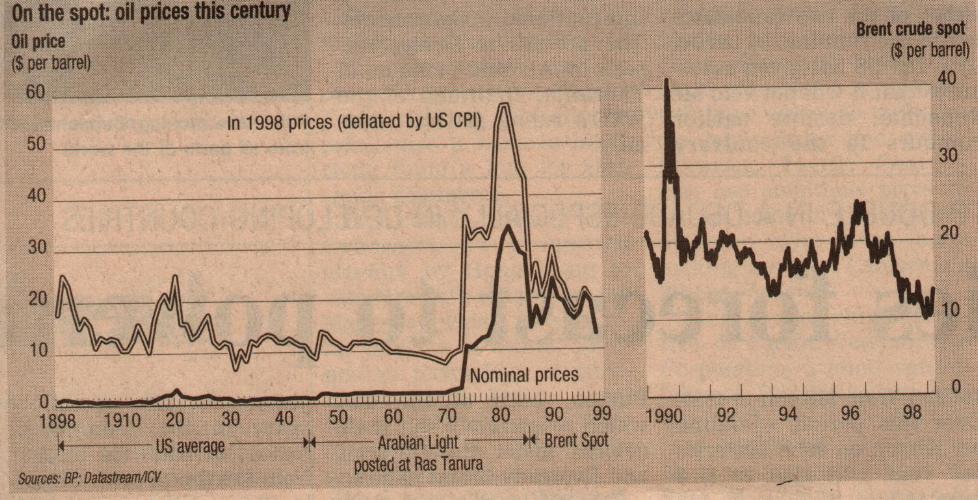
Note by Robinson Rojas:  Cyclical changes from 1972 to July 1998
                         $ per barrel 1998 prices
                         -Source: British Petroleum as quoted in
                                  The Economist, August 15th, 1998
                          Figures in parenthesis: rounded price per barrel
--------------------------
1.- UP    1972( 7) 1973(10) 1974(34)
2.- DOWN  1974(34) 1975(32) 1976(33) 1977(33) 1978(32)
3.- UP    1978(32) 1979(67) 1980(72)
4.- DOWN  1980(72) 1981(61) 1982(54) 1983(46) 1984(43) 1985(42) 1986(20)
5.- UP    1986(20) 1987(26) 1988(20) 1989(23) 1990(30)
6.- DOWN  1990(30) 1991(23) 1992(22) 1993(18) 1994(17)
7.- UP    1994(17) 1995(18) 1996(21)
8.- DOWN  1996(21) 1997(20) 1998(12)*1999(10)(March)**
---------------------------
* forecast based on prices up to July 1998
** actual price
________________________________________________________________________
Diverging prices for commodities and manufactured goods in the
international market during the process of globalization:

UNIT VALUE INDEX
of       manufactures   Petroleum  Agriculture Metals and Fertilizers
         exported by                           Minerals
       France, Germany,
      Japan, United Kingdom,
       and United States
1965        100             100         100         100        100
1970        114              83         107         111         77
1975        205             767         190         143        405
1980        327            2683         329         257        331
1985        314            1983         238         189        228
1990        455            1667         238         270        256
1996        518            1483         298         241        308

Source: "Global Economic Prospects and the Developing Countries. 1997",
        A World Bank Book, 1997
--------------------------------
ANALYSIS:

From: GLOBAL ECONOMIC PROSPECTS AND THE DEVELOPING COUNTRIES,World
      Bank, World Bank, 1996
      Commodity prices and manufactured goods prices. Index

G-5 unit value index of manufactures*
                 1965   100
                 1970   114
                 1975   205
                 1980   327
                 1985   314
                 1990   455
                 1994   486

Commodity price indexes
                         Metals     Cash
                           and      Crops    Food   Oil
                         Minerals
                 1965      100       100      100    100
                 1970      105        97      113    100
                 1975      166       155      194    850
                 1980      283       300      326  2,400
                 1985      210       198      255  2,100
                 1990      244       227      213  1,667
                 1994      207       250      270  1,167

Commodity price indexes as % of G-5 manufactured goods index

                         Metals     Cash
                           and      Crops    Food   Oil
                         Minerals
                 1965      100       100      100    100
                 1970       92        85       99     88
                 1975       81        76       95    415
                 1980       87        92      100    734
                 1985       67        63       81    669
                 1990       54        50       47    366
                 1994       43        51       56    240
__________________________________________________________________
CENTRAL TENDENCY FOR VARIATIONS- 29 YEARS
                           AVERAGE ANNUAL GROWTH
                    G-5       METALS     CASH      FOOD      OIL
                 MANUFACTURES AND        CROPS
                              MINERALS
------------------------------------------------------------------
1965-1994             5.6       2.5       3.2      3.5       8.8
------------------------------------------------------------------
1965-1980             8.2       7.2       7.6      8.2      23.6
------------------------------------------------------------------
1980-1994             2.9      -2.2      -1.3     -1.3      -5.0
__________________________________________________________________
__________________________________________________________________
* United States, Japan, Germany, France, United Kingdom

________________________________________________________________________

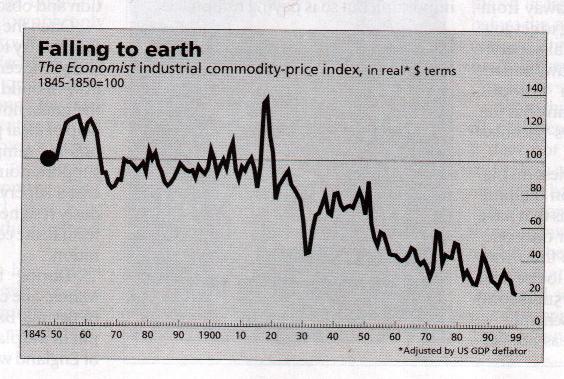
The Economist Index for industrial commodities price: 1840-1999


From Financial Times, 23 March, 1999, "OPEC determined to reach the
                                       oil price "comfort zone"
________________________________________________________________________
Back to World Prices
|